5 Help Desk Metrics Every Small Support Team Should Track

Anahita
- 2026-11-18
- Best Practices & Strategies
The most useful help desk metrics show where customers are waiting, how often they need to follow up, and whether your team’s answers actually help. Start with five numbers you can review each week. When one changes, read a few of the tickets behind it before deciding what to fix.
1. First response time
First response time measures how long a customer waits for the first reply from an agent. Start the clock when the ticket arrives and stop it at the first human reply. Decide whether to count business hours or calendar hours, then apply that rule consistently.
If first response time rises, look at when the slowest tickets came in. A cluster of tickets left until Monday may point to a coverage gap. A queue of unassigned tickets during business hours may point to a routing problem.
2. Resolution time
Resolution time measures how long it takes to resolve a ticket after it’s opened. The median gives you a sense of the typical wait, while a review of the longest cases shows where customers can get stuck.
If agents reply quickly but resolution time keeps rising, look at tickets that changed hands. For example, refund requests might sit with billing because the handoff leaves out the order number or fails to say who should approve the refund.
3. First-contact resolution
First-contact resolution is the share of resolved tickets handled in one support interaction. For email support, a practical definition is a case the agent resolves in one substantive reply, with no follow-up needed for the same issue within a set period.
If this rate drops, read a few conversations that needed several replies. If agents repeatedly ask for the same missing detail, such as a product model or order number, add an optional field to the relevant support form or improve the first reply.
4. Ticket backlog
Your backlog is the number of unresolved tickets at a set point in time. Count it on the same day each week and check how old the open tickets are. Twelve tickets opened yesterday tell a different story from twelve tickets that have been waiting a week.
If the backlog grows, check which tickets need action from your team and which are waiting for a customer reply. That gives you a shorter list of cases your team can move forward immediately.
5. Customer satisfaction (CSAT)
CSAT measures how customers rate their support experience. If you use a five-point survey, divide the number of ratings of four or five by the total responses, then multiply by 100. Record the response count alongside the percentage. A score based on five replies can swing sharply from week to week.
Sample weekly help desk scorecard
| Metric | Previous week | This week |
|---|---|---|
| Median first response time | 3 hours | 5 hours |
| Median resolution time | 22 hours | 24 hours |
| First-contact resolution | 68% | 67% |
| Open tickets at week-end | 18 | 25 |
| CSAT | 90% (18 of 20) | 89% (16 of 18) |
In this example, first replies slowed and the backlog grew. Start by checking when those open tickets arrived and whether they had an owner. If most came in over the weekend and stayed unassigned on Monday morning, try assigning someone to review that queue first thing Monday. Check the same two numbers the following week to see whether it helped.
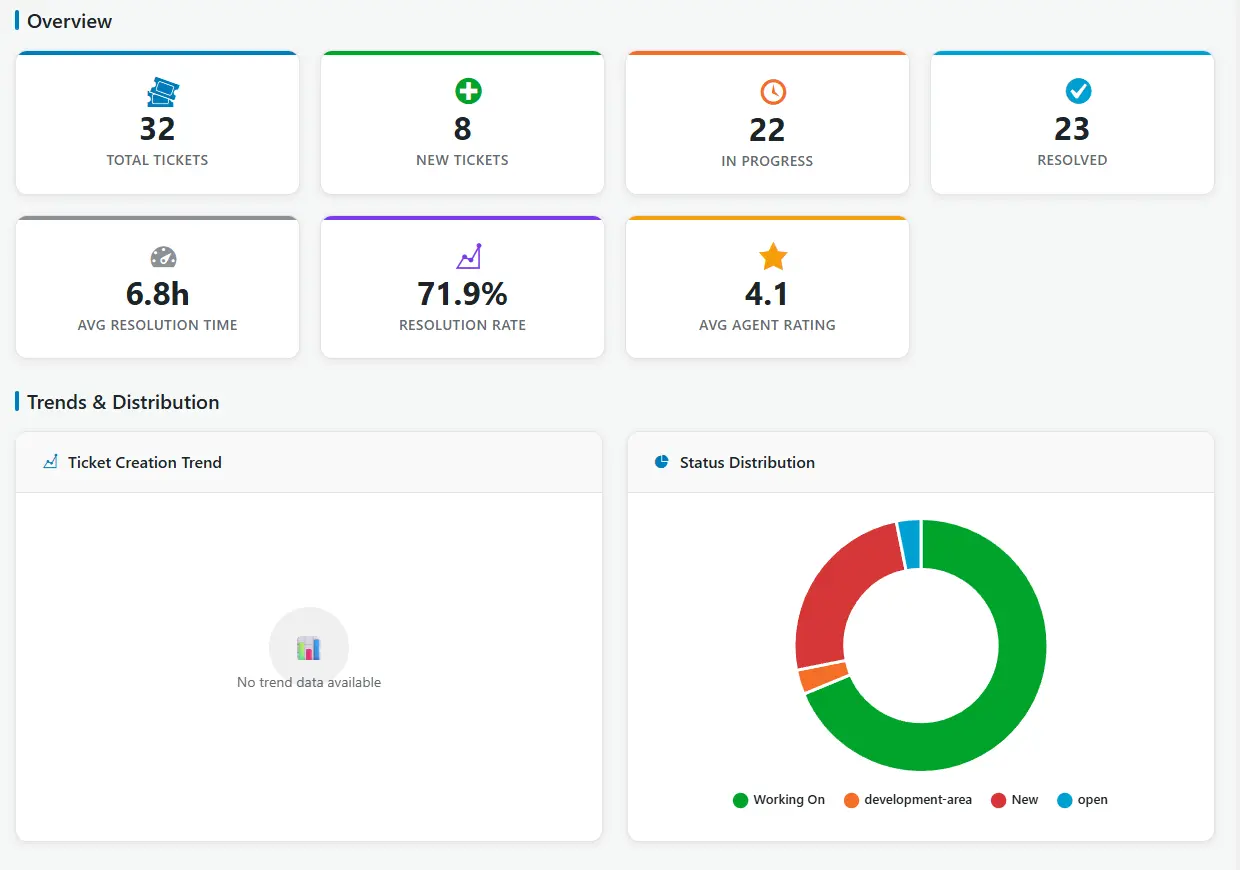
Manage and review support tickets in WordPress. Smart Support includes reporting on ticket volume, status, ratings, resolution, & agent performance.
Enjoyed this article?
Subscribe to get new posts by email.

About the author
Smart Support Team builds tools for happier, faster support.
